Intuitive, At-a-glance Data Visualizations Tailored to Your Network Demands
GenieATM Visual Portal transforms your GenieATM data and reports into clear visualized forms. From geographical attack traffic location, customized dashboard, to in-depth graphical representations and breakdowns, manage your network security and respond to mission-critical events within just a few clicks.
Scroll Down
FEATURES
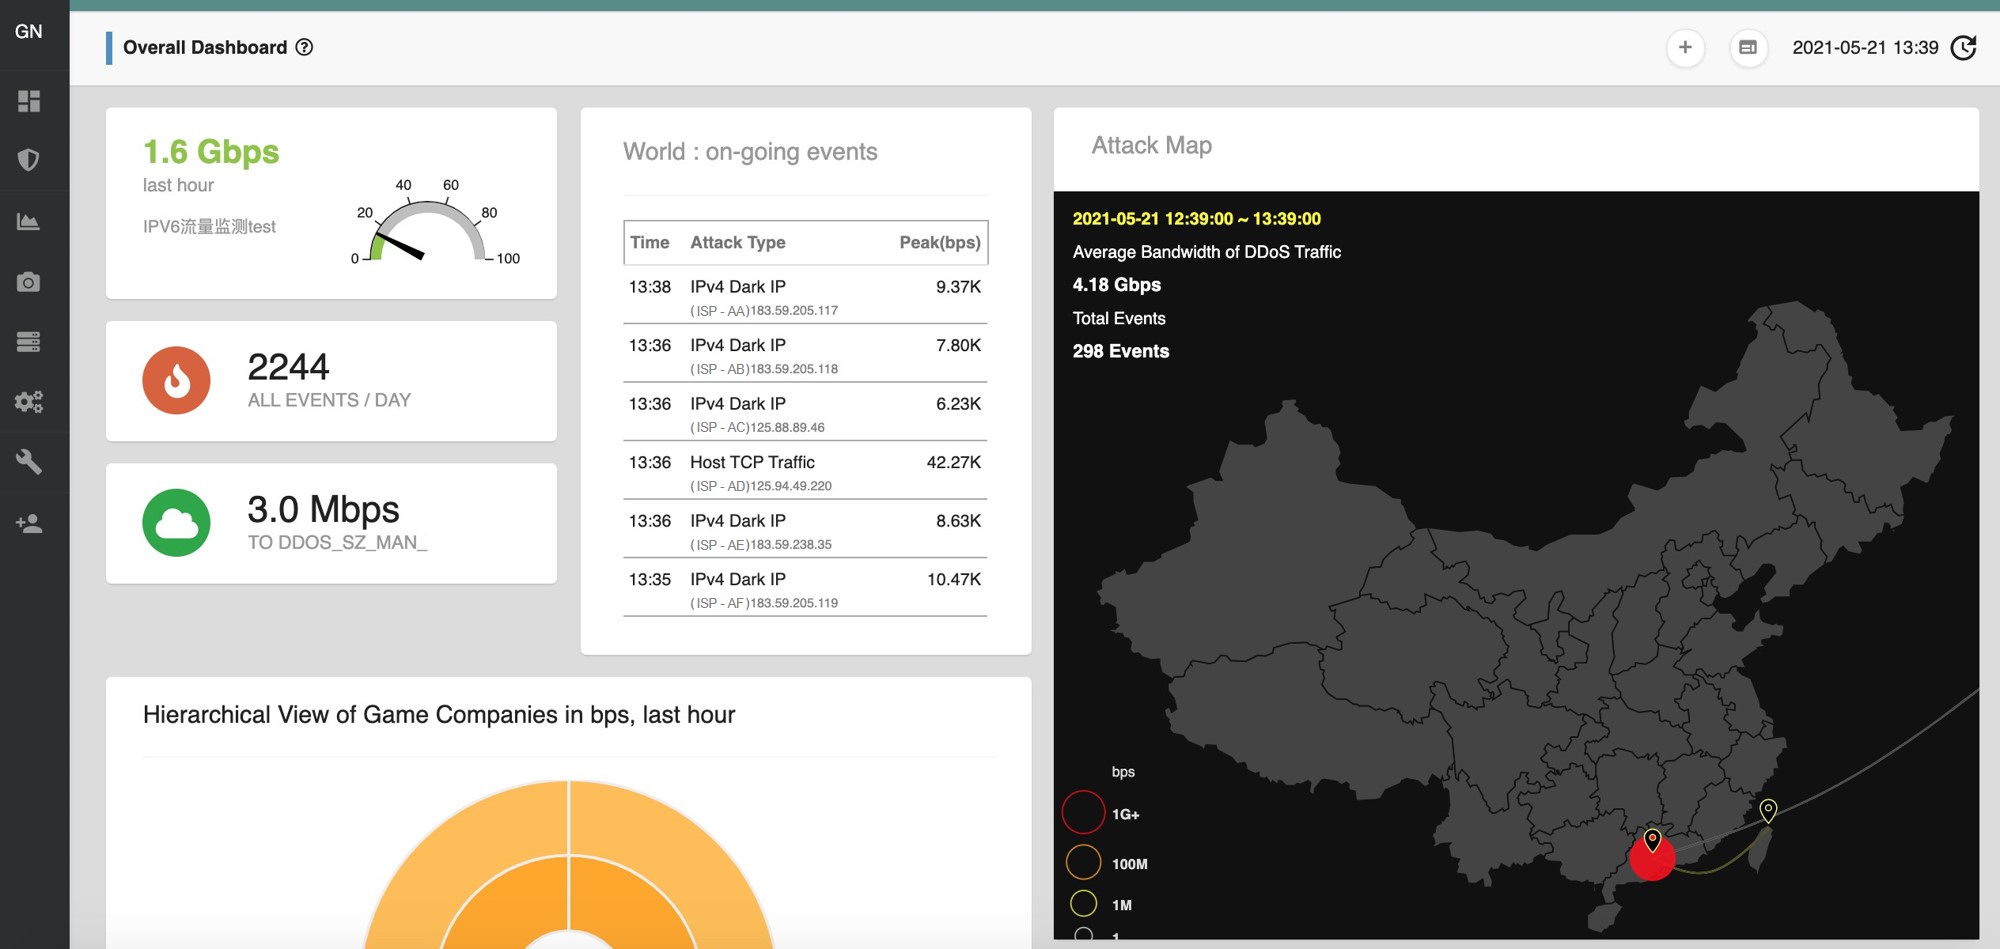
Attack Traffic Map
The animated Attack Traffic Map gives you a clear view on any detected attacks among multiple pairs of network locations. Monitor your sub-networks for any suspicious traffic and anomaly event from anywhere in the world, in real-time or within a specific time range, at ease.
Get total control over every aspect of your network traffic data with the highly customizable dashboard. Create your own custom dashboard with one or multiple widgets that display your desired network information. Easily add, configure, and save multiple dashboards to suit your monitoring needs.
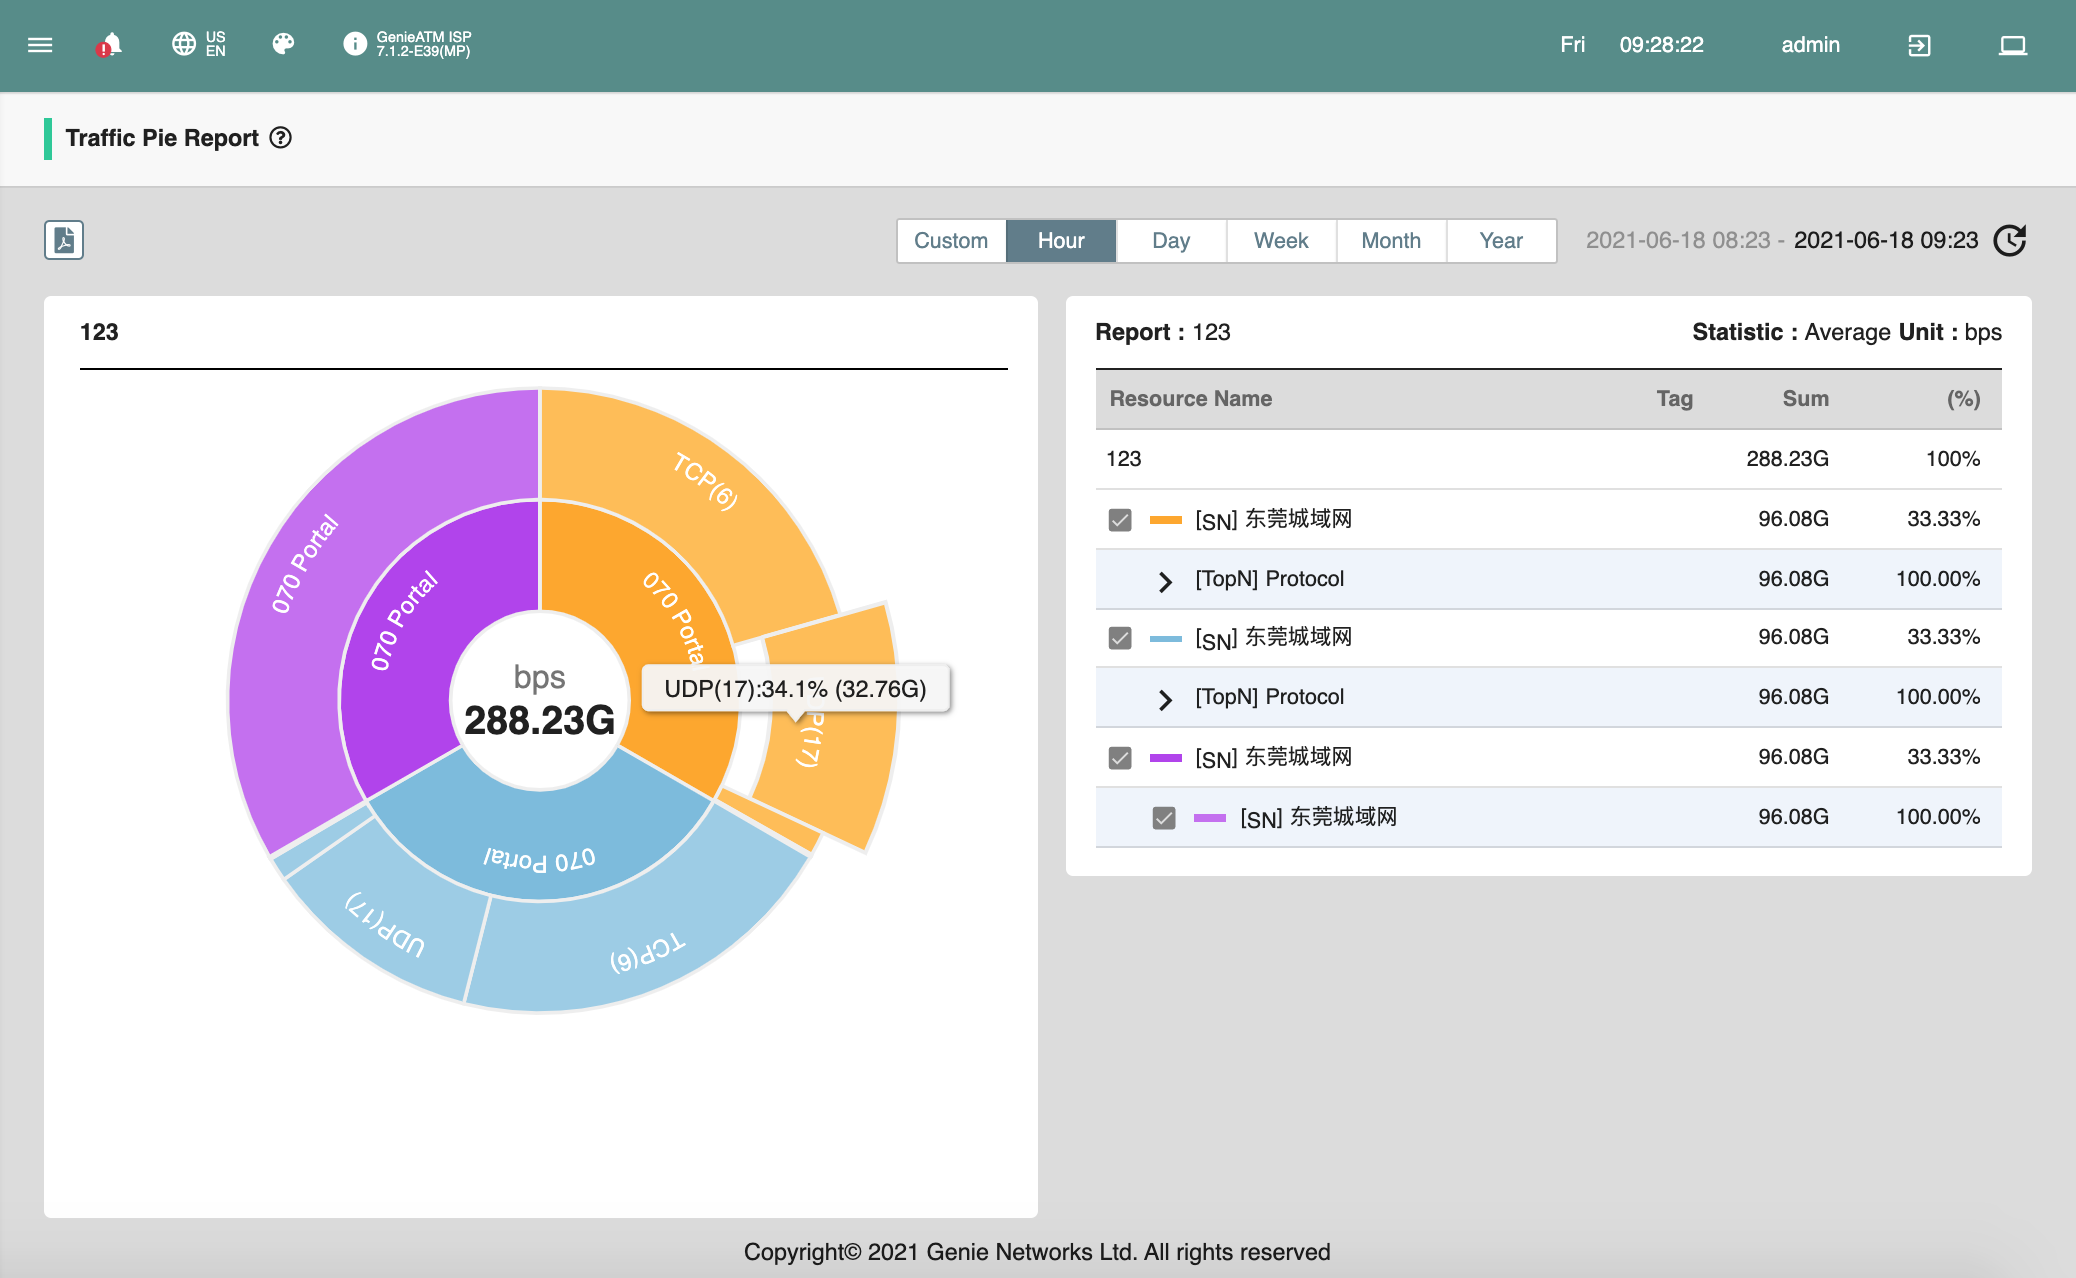
Create your custom hierarchical pie chart by selecting multiple traffic filters, network resources (e.g. sub-networks), or Top-N breakdown configured on your GenieATM. Drill down by simply clicking on an area in a pie chart to get more in-depth information of each traffic source. The power of intuitive data exploration is in the palm of your hands.
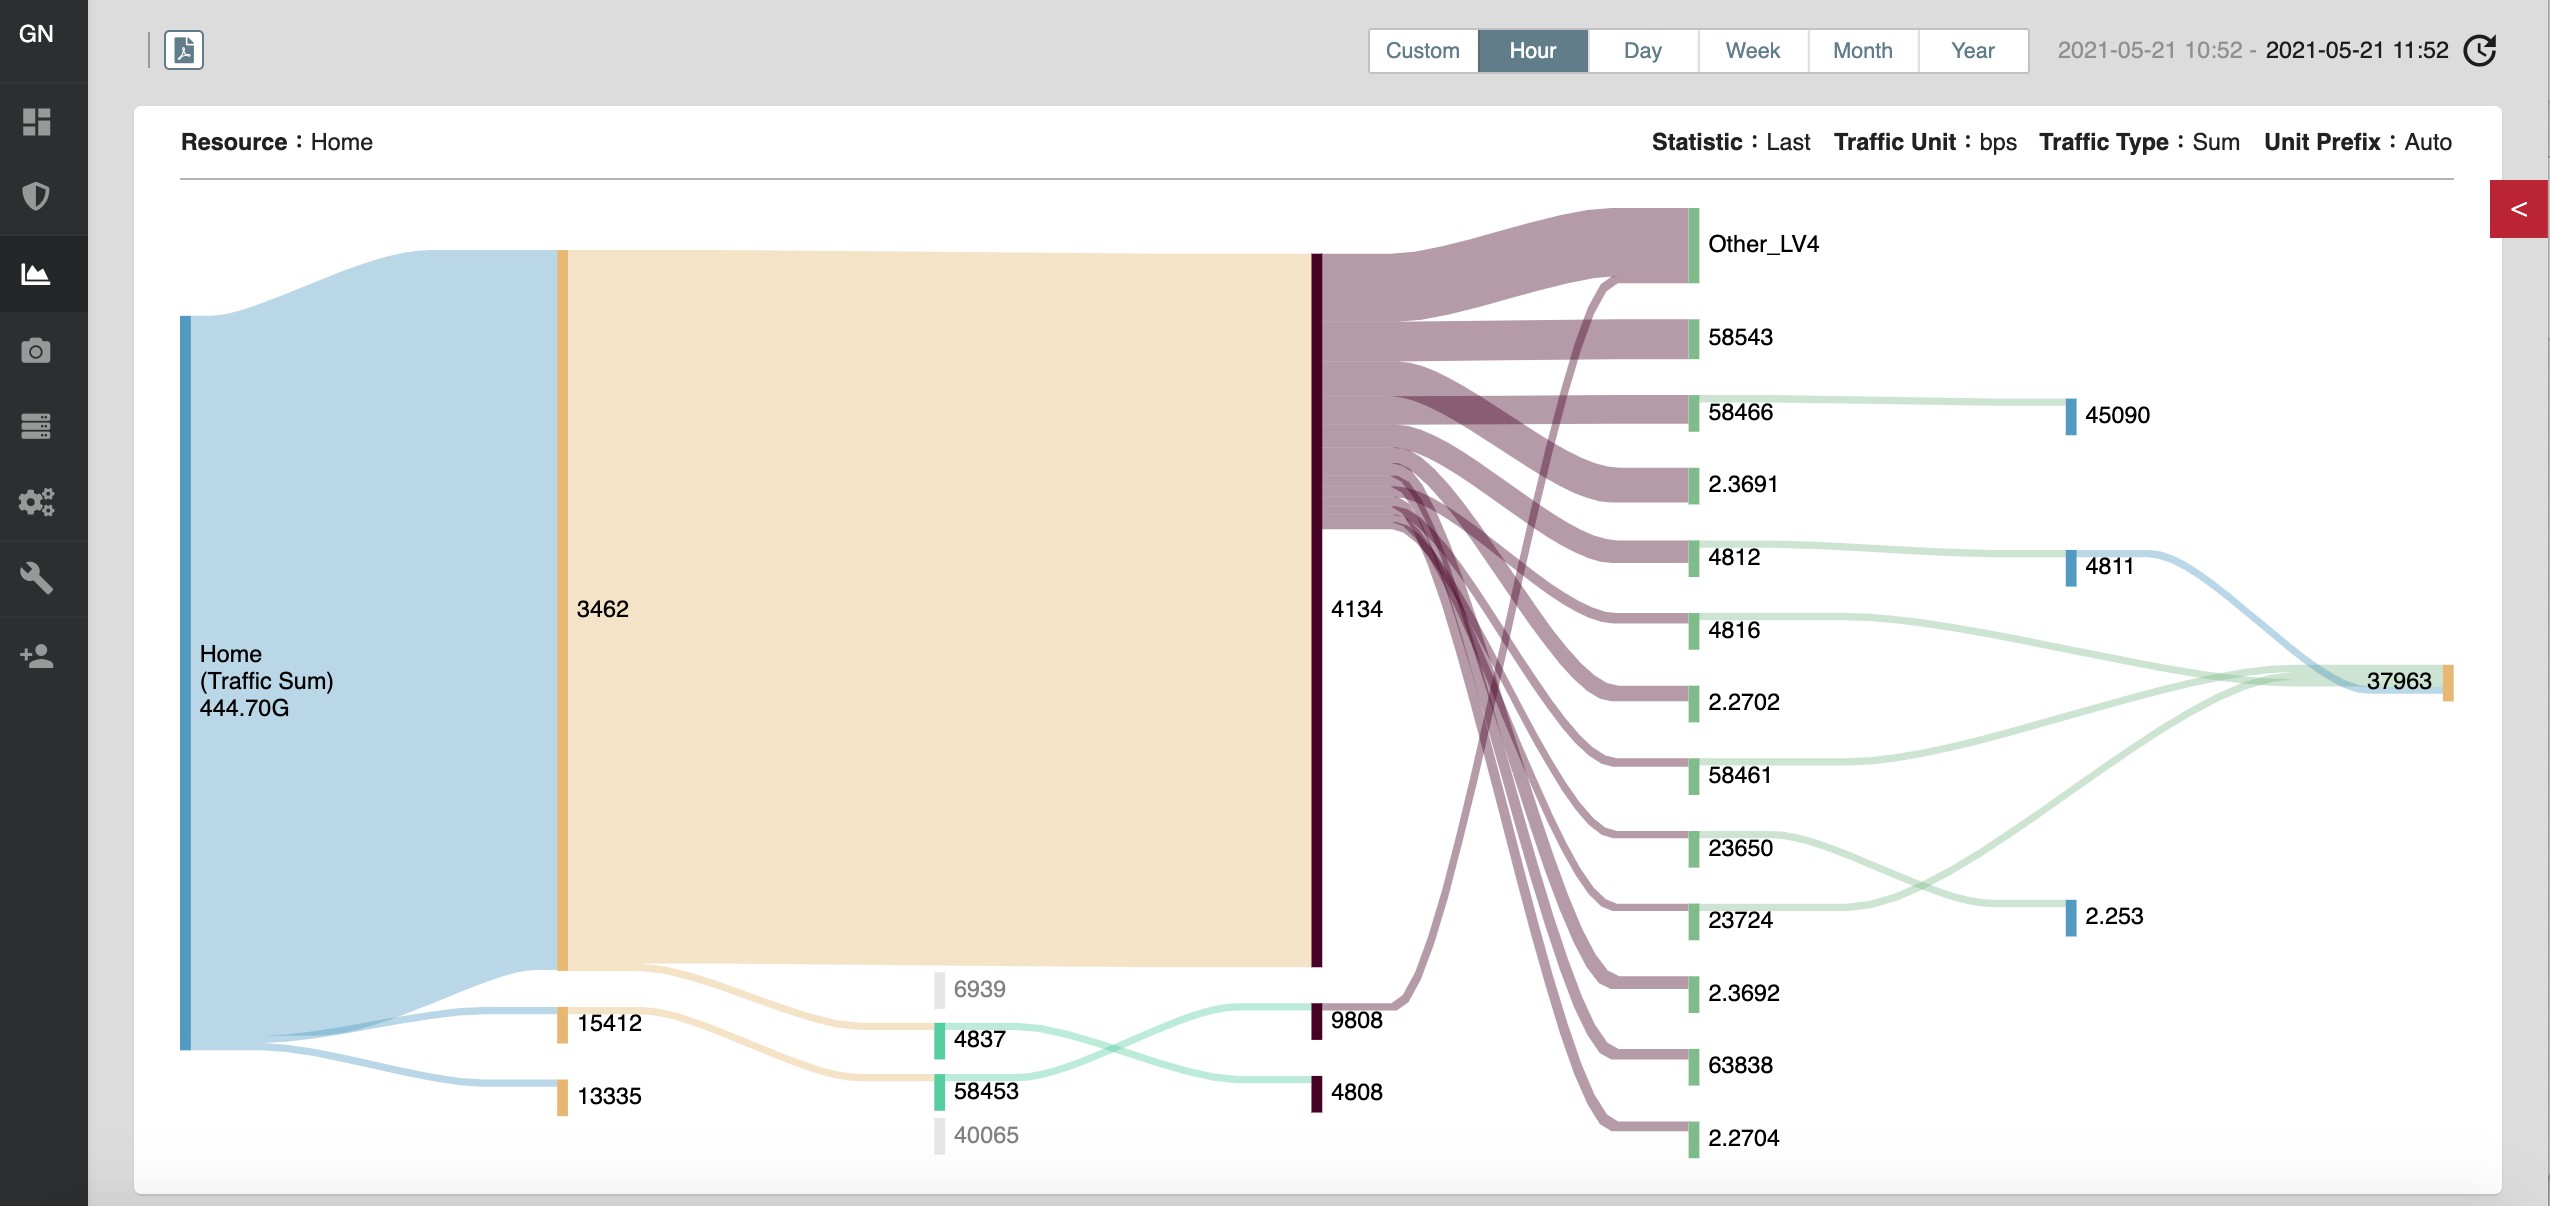
Your traffic path and matrix reports generated from sub-networks or filters of your GenieATM are provided at a glance with Sankey Diagrams. Get a solid grasp of significant relationships between different ASNs and different aspects of specific traffic.